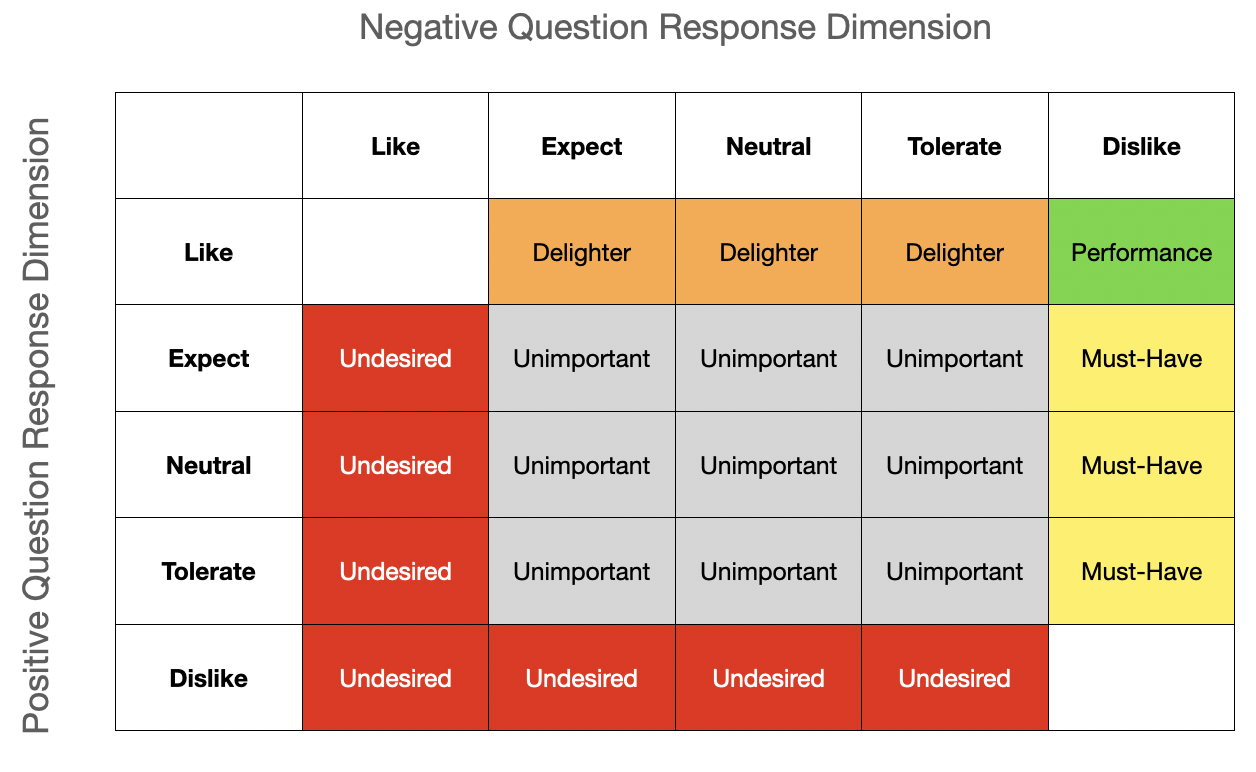
As discussed in my last post on Kano, the model provides you with a categorization of customer satisfaction on a feature-by-feature basis. This can then feed into prioritizing your plans. This is all great, except it doesn’t help explain how to really put this tool to use.
In this article, I am going to discuss some practical aspects of working with Kano. Here are specific topics I will cover.
- Survey Based Research
- Feature Selection
- Select the demographic attribute that will be meaningful to segment on
- Write the survey
- Distribute
- Collect Results and Analyze
Survey Based Research
Kano is a research methodology using surveys to discover how to categorize types of features you may be considering investing in. This means, you will need to define questions, an audience, a tools for conducting the survey, and collect results and analyze them.
?The output of Kano is a categorization of features as: Must-Haves, Performance, Delighters, Unimportant, and Undesired.
This works can take some time as it is not entirely in your control how quickly respondents get back to you. It also takes some time crafting a good survey but much less time than interviews and other research methods do.
This is not to say you can’t use some subjective analysis of your feature options to come up with your hypothesis on what the categorizations will be. I do this all the time and in some cases, this may be sufficient for your work. However, the purpose of the survey is not to simply validate your hypothesis but to help you uncover surprises along the way.
It is my experience that customer research frequently yields some surprising findings. These are the insights you need to increase your confidence in your product strategy and investment priorities.
Feature Selection
To get started with the Kano Model you need a set of questions to ask about features. How do you pick which features to ask questions about? Here are several considerations in selecting your features.
Consideration 1: Quantity
The format of a Kano survey is requires that you ask a pair of questions for each feature you are interested in getting feedback on. This means that for every feature you will have two questions which quickly makes for a long survey. Since we often have far more to prioritize, keeping it short is your first challenge.
IBM Design suggests keeping your number of features to 15-20. Then they suggest asking not 2 but 3 questions per feature. In my experience of doing all types of surveys with B2B customers, this is too long for most respondents to complete.
I suggest finding about 10 features worth researching. This will translate into 20 questions on the survey. Since Kano uses paired questions, anything longer risks lower response rates, incomplete surveys or respondents not thoughtfully answering.
Consideration 2: Outcome versus Feature
I am a big proponent of planning around desired outcomes. That said, the Kano Model was not conceived in this context and I have not experimented with using it with behavioral outcomes as the focus on my questions. When I try this out, I will let you know how well it works.
For now, I stick to a more feature based approach. Then do separate analysis on features to tie them to desired outcomes.
Example: Let’s say that LinkedIn is considering adding a Mentoring capability to their online networking platform. Rather than asking respondents about the outcome of mentoring programs, of which there are many, the question will give an overview of what a Mentoring capability is (including potential benefits) and then pose the question specifically on the feature.
Mentoring Overview: Many LinkedIn users find and connect with mentors through the online service to support their professional development. Specific Mentoring capabilities would help to make these connections between interested parties and facilitate an ongoing relationship to optimize results for the Mentee and Mentor.
Q1: If you have the ability to mentor or be mentored through LinkedIn, how do you feel?
Q2: If you don’t have the ability to mentor or be mentored through LinkedIn, how do you feel?
You can see in the example that I describe a capability and only allude to the benefits (outcomes) it may provide. Using this approach works very well when describing well-known features found in other products.
With Chainlinq, for example, there are a number of features I believe the market expects as a baseline to make it minimally viable for early adopters: one example are ‘member profiles’. If I start asking about the multiple outcomes member profiles achieve, and not about the profiles as a feature, I may not build this feature and miss something customers consider Must-Have, aka table stakes.
On the flip-side, if I ask about ‘member profiles’ and find that it is considered an Unimportant feature, then I have gained a huge insight into how customers see this feature as delivering on the anticipated value proposition of the overall product. Any outcomes I had attributed to it, I can then reassess.
Consideration 3: Granularity
Since you are limited to only a handful of features you probably don’t want to ask anything too specific. More importantly, since the output of Kano is a categorization of features so that you can make decisions on how much to invest in them, you need to ask about the features in a manner that gives you various degrees of freedom.
Recall that the model from Kano gives us an understanding of the importance of investing in each category from not-at-all to substantial. See the x-axis of the diagram below as the investment from Missing Functionality to Functionally Robust.
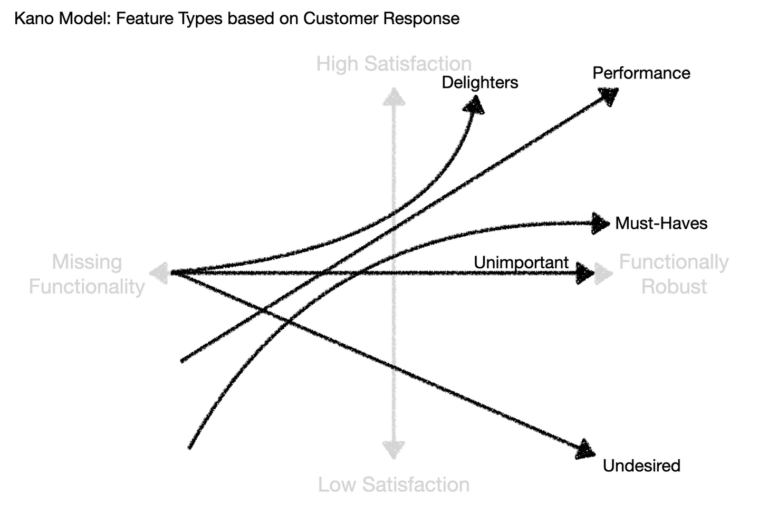
With the LinkedIn example previously discussed, by keeping the question on “the ability to mentor or be mentored”, it gives you the opportunity to invest a little or a lot driven, in part, by the categorization it takes.
If the LinkedIn example was more precise, say, “the ability to mark yourself as open to mentoring others”, there is very limited investment flexibility. You either have such a functionality or you do not.
As such, you must keep the features in your questions at a high-enough level to allow for varied investment levels. This works well, since you want to limit the quantity of features you ask about anyway.
Respondent Demographics
Let’s say you send out surveys and get a great response. When you start to evaluate the results they may seem muddled and inconclusive. Frequently, this is the result of having different types of respondents aggregated together.
Leveraging my earlier example of a LinkedIn mentoring feature, if you blast out the survey to a couple hundred LinkedIn members you may find limited actionable information. The key here is to be very aware of the target audience for your survey and features so that you can properly define a handful of useful demographic questions.
Now, if you are LinkedIn running such a survey, you probably have all the demographic data you need. With a bit of analysis you may find that they categorization of the feature is dependent on the Role or Industry that the respondent has.
If you aren’t LinkedIn, I recommend asking a few demographic related questions that are likely to help you segment your responses into meaningful data. To determine what characteristics to ask, you need to do up-front research on your market and customers to make you best guess.
Keep the questions short and don’t ask things unlikely to give significant segmentation value. Less is more, wherever possible.
Write the Survey
Depending on the technology tool you use to facilitate your Kano survey, you may have a lot of flexibility in how you write the survey. I recommend keeping it simple with the basic structure:
-
Survey Introduction
-
Demographic Questions: 3-5 questions
-
Paired Feature Questions: 20 questions (on 10 features)
Paired Questions should provide a descriptive overview followed by both the POSITIVE and the NEGATIVE form of the question.
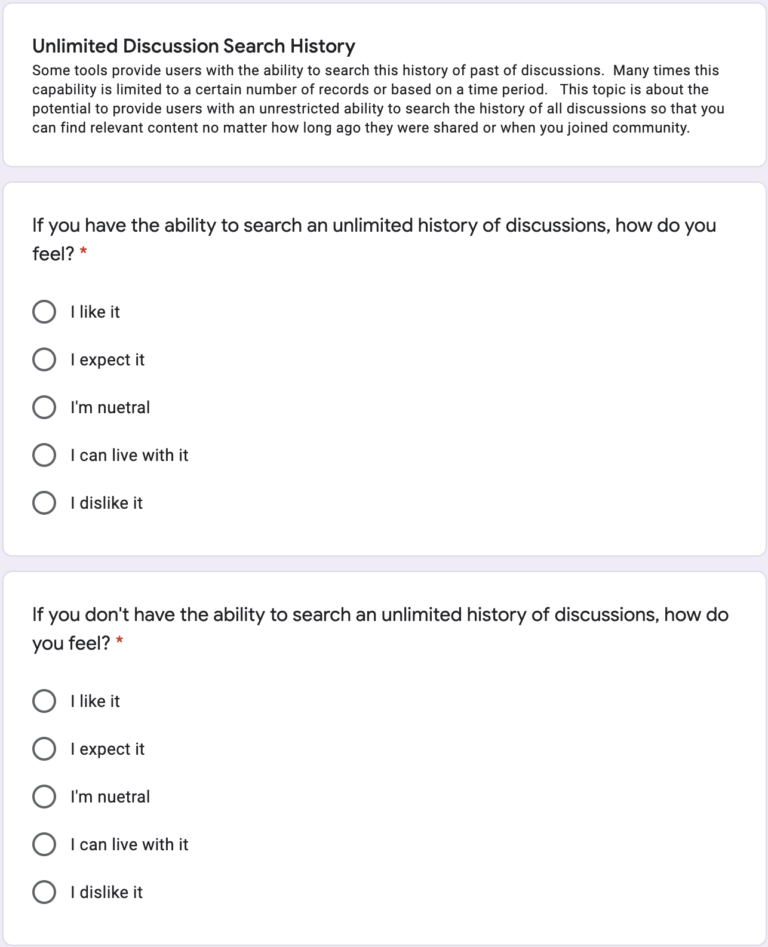
Note: In the Folding Burritos guide, they recommend showing the feature whenever possible beyond just a text description. The problem with showing features in software is that it creates an expectation of how something should work to users.
This becomes a constraint on the different levels of investment possible to provide similar functionality. As such, I recommend being careful around visualizing any potential feature investments for this reason.
Importantly, don’t get cute trying to make the survey look better or more efficient to complete (like the example below). This can have the unintended consequence of making it faster to cheat by not thinking through responses and simply ensuring each pair has opposite answers.
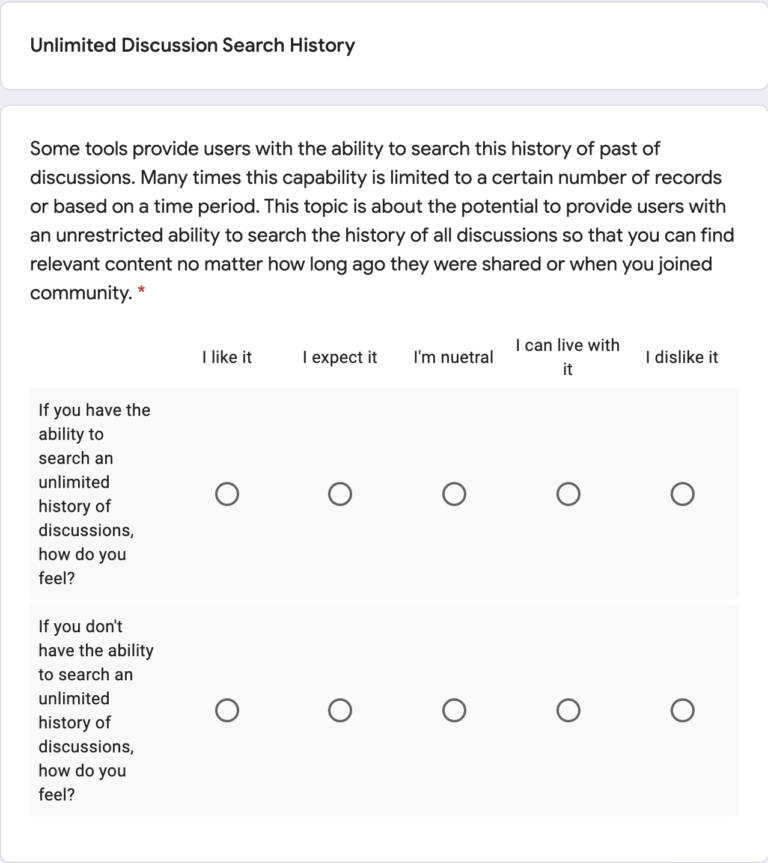
If your tool is smart enough to randomize the section of the paired questions, this may help eliminate any issues that may be due to response fatigue. Especially, if you break the quantity guidance and put 50 questions into the survey, response quality will diminish at some point. If each pair shows up in different locations for different respondents it will reduce some of this fatigue effect.
Before finalizing the survey, run it through a simple test. Have a couple people complete it that were not involved in its creation and give you feedback before wider distribution. Ideally, this will include a customer and not just other internal stakeholders.
Distribute
Once you have your survey ready to be distributed you will need to get it out there. The number of people to survey is going to be dependent on the scope of features you are researching and the likely segmentation of your audience.
For me, with a narrowly scoped customer definition at Chainlinq, I can get away with 10 surveys to community hosts and have meaningful results. If I also include the members of these communities then I need at least 10 of those responses too.
For the LinkedIn example above, if you do not carefully segment the target audience upfront you will get muddled responses due to the breadth of users on their platform. However, since they have the ability to survey potentially hundreds of users and then segment the data, this may be more the scale they should work toward.
In either case, small sample or large sample sizes, you can always ask more people to response if the initial responses are muddled. Increasing the sample size may help you uncover meaningful segments that you did not expect.
Collect Results and Analyze
Now that you have survey responses pouring in you will want to immediately collect and analyze the results. Kano produced a somewhat straightforward model to help categorize your results by charting response counts against a simple matrix with each cross product representing a specific category.
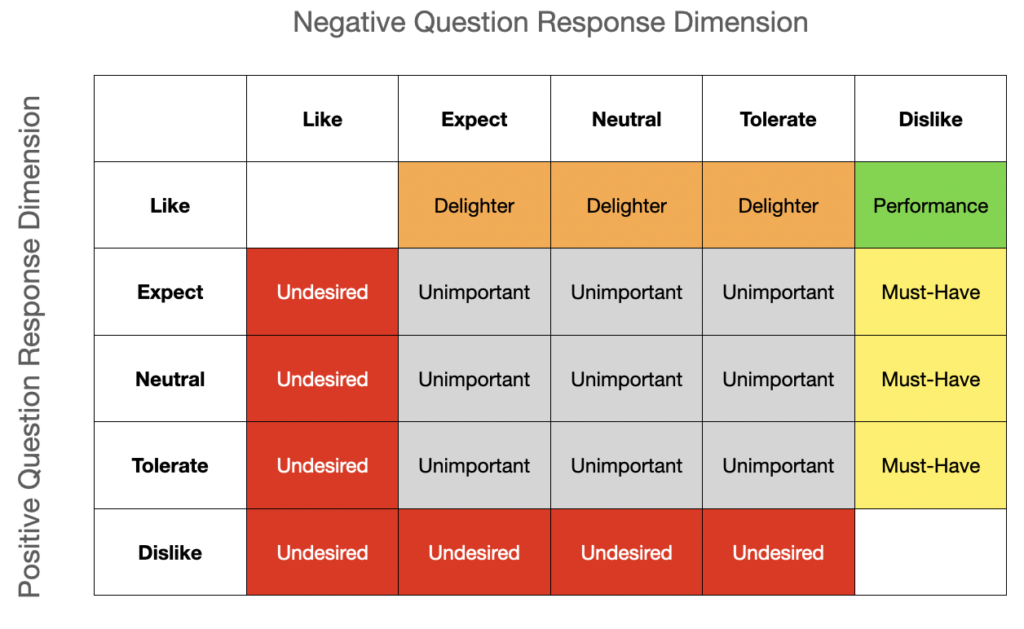
Continuing on with the LinkedIn mentoring example. Let’s say they sent out their survey to 500 people and got 167 responses. The matrix may look like this:
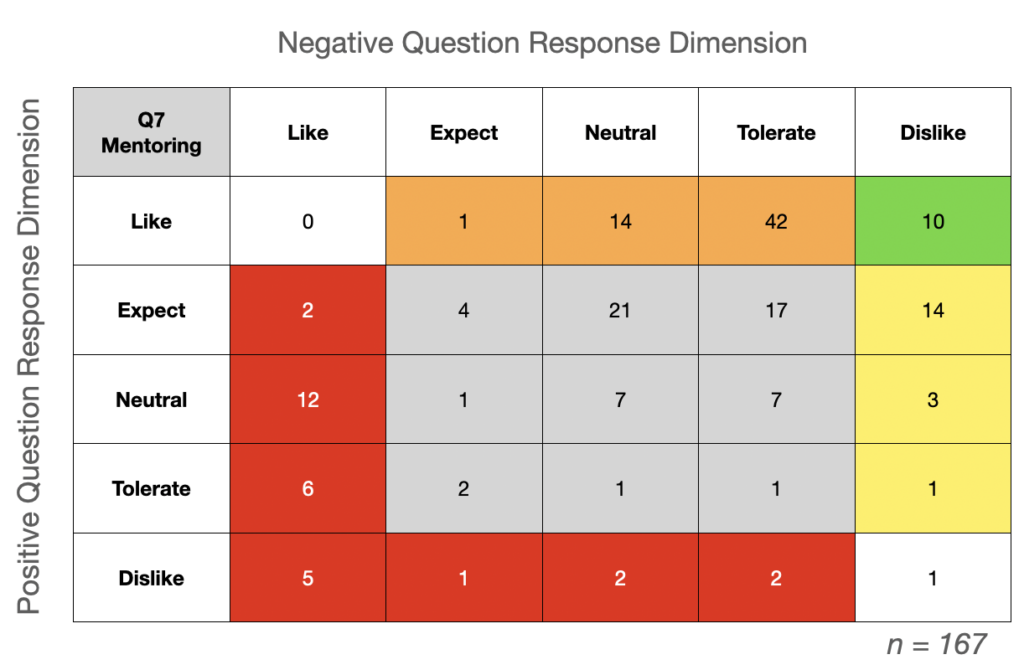
Not surprisingly, everyone that replied did not answer exactly the same way. We can see a clustering of the results around Delighter. While no survey is going to give you perfectly clear answers, this gives a pretty clear indication of how a significant population of user feel about this capability.
This is the most basic way to analyze the results and good enough for many situations. Once again, if you want more sophisticated tools to understanding these results, including some of the distributed outliers, I recommend reviewing the Folding Burritos article section titled Step 3: Analyze the Results.
Conclusion
The Kano Model is one of those apparently simple tools that quickly gets more complex as you attempt to implement it. Still, just using the concepts you can quickly build a straw-man categorization on your own (backed by good research). Then iteratively build a survey tool and process to distribute and get results.
After categorizing the results you are not done, of course. You need to make use of this data in your planning process. In my prior Kano article, I talked about what you can do with features that fall into each category.
Further, you should share this information with your product marketing peers. This helps with competitive analysis and positioning of existing capabilities.
I need to get some research done myself now.
